
|
|
October 1st, 2024: we are pleased to announce the release of our new webservice: FoldScript |
| What is ENDscript? |
|---|
|
ENDscript is a friendly Web server, which extracts and renders a comprehensive analysis of primary to quaternary protein structure information in an automated way.


|
| ENDscript main key points |
|---|
|
From a typed PDB identifier or an uploaded PDB file, ENDscript quickly generates the following downloadable illustrations:


|
| ENDscript is easy! |
|---|
|
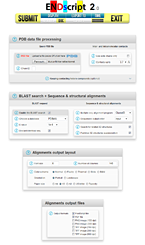
We put a lot of effort to make ENDscript fast and convenient:

|
| How does ENDscript work? | |
|---|---|
ENDscript uses as query either a four digit PDB identifier (e.g. 2CAH) or an uploaded coordinate file in PDB format (NMR and crystallographic structures are supported).The ENDscript automated pipeline involves numerous sequence and structure analysis programs and is divided in three succeeding phases:
|
ENDscript can handle up to 3,000 distinct sequences adorned with their secondary structure elements and render their representation in the gigantic 'Tapestry' format (0.8 × 3.3 meters)! 

|
| Examples of ENDscript outputs | |||||
|---|---|---|---|---|---|
|
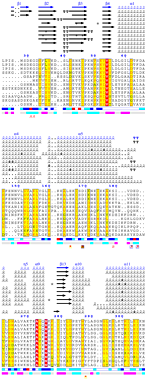
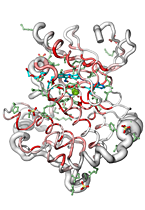
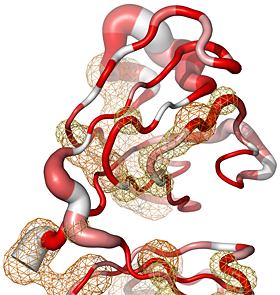
Here are some excerpts from ENDscript-generated flat figures and PyMOL sessions (PDB entry 3OYA). (Click on the thumbnails to access full-size pictures) | |||||
 ENDscript phase 1 Query only |
 ENDscript phase 2 Query and homologous |
 ENDscript phase 3 PyMOL Cartoon representation |
 ENDscript phase 3 PyMOL Sausage representation |
 ENDscript phase 3 PyMOL Surface representation |
 ENDscript phase 3 PyMOL screen capture |
| |||||
| ENDscript is open to external bioinformatics services |
|---|
|
We have designed ENDscript 2.x as an open platform for the visualization of multiple biochemical and structural information:

|
| Terms of use |
|---|
|
|
|
© 2005-2024 The ENDscript authors & CNRS - Contact: espript@ibcp.fr ESPript is an SBGrid supported application |